A technical analysis community,
master trends through channels
Follow trend channel signals for Taiwan, US, and Hong Kong stocks. Analyze market moves with fellow traders and find the best entry points.
Free · No sign-up · Instant result
Before you draw anything — is the channel even trustworthy?
Enter any HK or US ticker and get a trend channel fitted automatically, with its reliability quantified. Formula-generated: the same data always yields the same channel.
Fitted by formula, not drawn by hand
Theil–Sen robust regression with residual quantiles. No anchors to adjust after the fact, and no room for “it should bounce at the top rail” reasoning.
Tells you whether to trust the channel
R² answers “is this actually a trend”; stability answers “how far does the rail move if the window shifts”. A good-looking channel is not a reliable one.
Quantifies how fragile your stop is
κ = stop ÷ (entry − stop). A 1% stop gives κ≈99: you think you are risking 1%, the real figure may be 1.5% — and nothing tells you.
Popular tickers
Core Features
3-Point Parallel Channels
Click 3 points on the candlestick chart to automatically generate upper, lower, and mid-channel lines. Supports slanted channels that follow real price trends.
Real-Time Alerts
Send Telegram / Email notifications instantly when price touches the channel top or bottom. Automatically enters standby mode when price is outside the channel.
Custom Dividers
Set the number of dividers within the channel to split it into multiple trading zones, defining entry and exit points with greater precision.
HK & US Stocks
Supports both Hong Kong and US stock markets simultaneously, monitoring channel positions for multiple stocks in real-time.
Multi-Channel Management
Set up multiple stock channels at the same time; the system monitors each channel independently and sends separate notifications.
Channel Status Overview
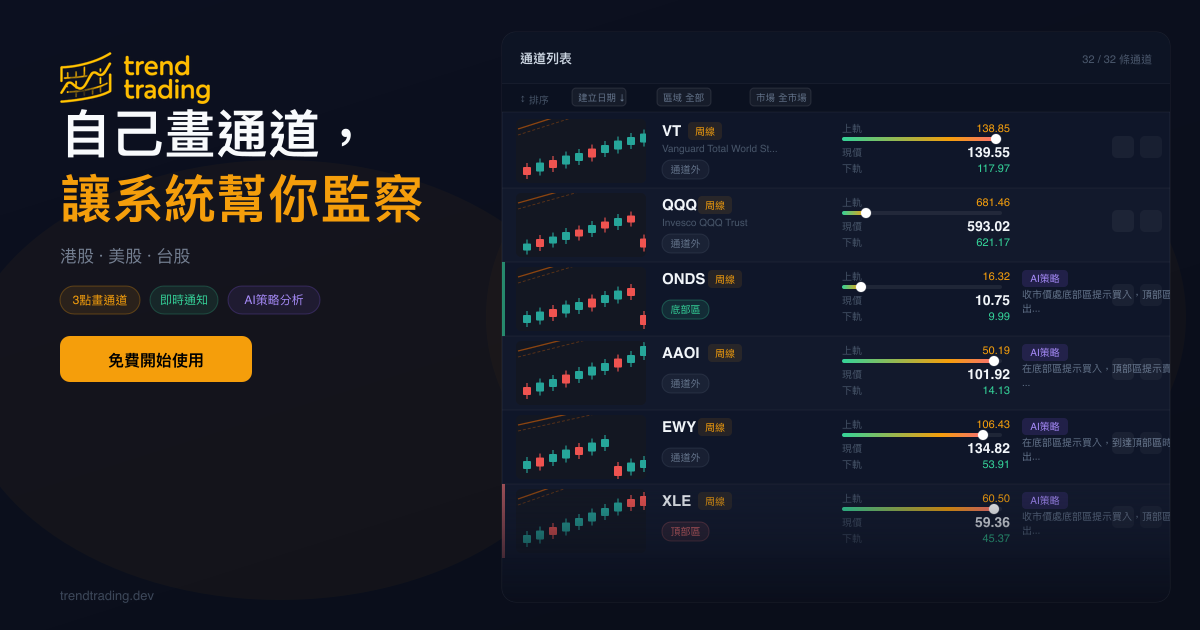
Dashboard overview of all channel statuses: whether price is inside the channel, which zone it's currently in, and recent notification history.
How It Works
Enter a Ticker
Enter a HK stock code (e.g. 00700.HK) or US stock (e.g. AAPL) to load the candlestick chart.
Draw Parallel Channels
Click 3 points on the chart; the system automatically calculates and draws the upper and lower channel rails.
Set Dividers
Choose the number of dividers inside the channel to define top, bottom, and middle zones.
Start Monitoring
The system tracks stock prices in real-time and alerts you when they touch channel boundaries.
Try It Free
Try the channel drawing feature for free and experience the full monitoring workflow.
Start Drawing